Miscellaneous On-Line Topics for
|
Return to Main Page
Exercises for This Topic Index of On-Line Text Everything for Calculus Everything for Finite Math Everything for Finite Math & Calculus |
Miscellaneous On-Line Topics for
|
Return to Main Page
Exercises for This Topic Index of On-Line Text Everything for Calculus Everything for Finite Math Everything for Finite Math & Calculus |
Domain and Range
It sometimes happens that one function "undoes" what another function does. For instance, if f(x) = 2x and g(x) = x/2, then f doubles input numbers, while g does the opposite. We shall refer to f and g as inverse functions. But before we can discuss inverse functions properly, we shall first need to review what is meant by the domain of a function, discuss the range of a function, and look at the manner in which functions interact with each other.
First, we review the concept of "domain" from the book.
|
Domain of a Function
|
Related to the above concept is the concept of the "range" of a function.
|
Range of a Function
If we think of a function as machine -- in goes x, out goes f(x) -- then the range of f is the set of all possible numbers that it spews out. |
Here is a graphical way of obtaining the range of a function. As an example, let us use f(x) = x2, whose graph is shown below. The range of f consists of all the possible y-values we can get. This amounts to finding all the heights of points on the graph of f. To find this graphically, pretend that a pair of elevator doors come in from both sides and squash the graph onto the y-axis. Then the resulting "squashed" graph gives the range of the function.
Looking at the "squashed" graph, we find it covers the interval [0, + ) on the y-axis, confirming that the range is [0, +
 ).
).
One-to-One Functions
We have seen in the Section 1.2 in the text-book that a graph in the xy-plane is the graph of a function with independent variable x if it passes the "vertical line test." That is, if each vertical line passes through at most one point of the graph.
Now pretend that we have the graph of some function that passes the "horizontal line test." In other words, suppose that each horizontal line passes through at most one point of the graph. The next figure shows the graphs of some functions, one which passes the horizontal line test, and one which fails it. Those that pass it are injective. (For an algebraic definition, see below.)
 |
 |
|
| One-to-one Each horizontal line passes through at most one point of the graph. |
Not one-to-one Some horizontal linea pass through more than one point of the graph. |
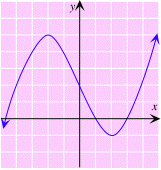
To interpret what it means algebraically for a function to be one-to-one, take a look at the graph of a function that is not one-to-one.

First, notice that the horizontal line through y = 2 passes through two points: (-4, 2) and (0, 2). Another way of saying this is that f(-4) = f(0) = 2. Similarly, f(1) =f(3) = 0, so that again we have different x-values that give the same value for f(x). Also, f(-1) = f(-3) = 4.
This does not happen in the case of one-to-one functions; it cannot happen that f(a) = f(b) for two different x-values a and b.It is for this reason that we call such a function one-to-one. (One-to-one functions are also called injective.)
|
One-to-One Function
|
![]() Example 2 Determining Whether a Function is One-to-One
Example 2 Determining Whether a Function is One-to-One
Which of the following functions is one-to-one?
 )
)
Solution
All we need to do is sketch their graphs and decide which of them pass the horizontal line test.
| (a) The graph of f(x) = 4 -x2 fails the horizontal line test, since the line y = 0 passes through the two points (-2, 0) and (2, 0). In other words, f(-2) = f(2) = 0, so this function is not one-to-one. |  |
Inverse Functions
Suppose you take a number x, double it and then halve the answer. You expect to get x back again. In a sense, halving a number is the reverse process of doubling it. Similarly, if you start with x, cube it, and then take the cube root of the answer, you again get back x. Thus taking the cube root of a number is the reverse process of cubing it. Let us express these simple situations in terms of functions.
![]() Example 3 Composing Inverse Functions
Example 3 Composing Inverse Functions
Let f(x) = 2x (the doubling function), and let g(x) = x/2 (the halving function). Calculate g(f(x)) and f(g(x)).
Solution
To evaluate expressions such as these, we start from the inside and work outward:
| g(f(x)) | = |
|
We substituted f(x) = 2x | ||
| = |
|
Since g(a) = a/2 | |||
| = |
|
| f(g(x)) | = |
|
We substituted g(x) = x/2 | |||||
| = |
|
Since f(a) = 2a | ||||||
| = |
|
Thus, g(f(x)) = x and f(g(x)) = x. This is how we say that the halving function and the doubling function are the "reverse" of each other. Formally, we refer to f and g as being inverse functions.
Before we go on...
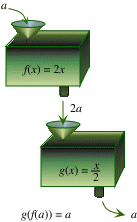
Here is a nice way of visualizing what is going on. Since g(f(x)) means "first apply f and then apply g," we can think of this as feeding the output of f into g, and seeing what we get. Here is an illustration of this process.

See if you can illustrate the corresponding process for f(g(x)).
|
Inverse Functions
f(g(x)) = x for every x in the domain of g. When f and g are inverse functions, we write g(x) as f-1(x). Note
|
Graphing Inverse Functions
Q How are the graphs of a function and its inverse related?
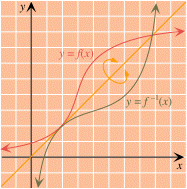
A Take a look at the figure which shows the graphs of f(x) = x2+1 and its inverse, f-1(x) = (x-1)1/2.
We have also included the graph of y = x to show the symmetry. Pretend that you held the two ends of the line y = x and flipped the portion of the coordinate plane shown so that the x-axis wound up on top of the original y-axis. Then the graph of f would land exactly on top of the graph of f-1. In other words:
Also notice something else from the graph: The range of f is [2, + ) and the domain of f-1 is also [2, +
 ). This is true in general:
(Note that, for example, (2,5) is a point on the graph of f, and the corresponding point on the graph of f-1 is (5,2). This is the way that individual points on the two graphs correspond: we interchange coordinates to go from the graph of f to the graph of f-1.
Q Why is this so?
A Let's suppose that the inverse functions we are considering are called f and f-1. Then their graphs are the graphs of the equations y = f(x) and y = f-1(x). Look at the equation y = f(x) for a moment. If we apply f-1 to both sides, we get f-1(y) = f-1(f(x)) = x, in other words, x = f-1(y). Thus, a point on the graph of f also satisfies the equation x = f-1(y). In other words, it is a point on the graph of f-1 if the x- and y-axes are interchanged. This means that the graph of f is the same as the graph of f-1, but with the roles of x and y interchanged. An easy way to interchange x and y is to flip the coordinate plane about the line y = x as shown below.

Q Do all functions have inverses?
A No. Think of how the graph of a function is related to the graph of its inverse. If the inverse function is to exist, then its graph is obtained from the graph of the original function by flipping about the line y = x. Now the resulting graph had better be the graph of a function, so it had better pass the vertical line test. But vertical lines correspond to horizontal lines under the operation of flipping. Thus, in order for the graph of the inverse to pass the vertical line test, it had better be the case that the function we started with passed the horizontal line test. This amounts to saying that the original function had better be one-to-one if it is to have an inverse!
Q Do all one-to-one functions have inverses?
A Yes. If f is one-to-one, then the flipping operation results in a graph that passes the vertical line test, and so is the graph of a function. A little thought will convince you that this function undoes what the function f did-in other words, that the new function is the inverse of f.
Here is a summary of what we have learned so far.
|
Graphing the Inverse of a One-to-One Function
|
Finding Inverse Functions Algebraically
Q I can obtain the graph of f-1 by flipping the graph of the one-to-one function f about the line y = x. This is a graphical way of obtaining the inverse. Is there an algebraic way of doing this? In other words, if I am given a formula for f(x), how do I get the formula for f-1(x)?
A This is answered by the next example.
![]() Example 4 Finding the Inverse of a Function
Example 4 Finding the Inverse of a Function
Find the inverse of the function f(x) = x1/3 + 2
Solution
First, we must check that this function is one-to-one. Its graph is the graph of y = x1/3 shifted up 2 units. To convince yourself that it passes the horizontal line test, either graph it on the Function Evaluator & Grapher or Excel Grapher. Alternatively, press here to see a picture of the graph. Thus the function f is one-to-one, and hence does have an inverse.
Here is a two-step method to find the inverse:
Before we go on... This process yields the inverse because of the above discussion on graphing an inverse function: the equation associated with the inverse function of a given function f is the curve y = f(x), but with x and y reversed. Thus, to see the form of this equation, we must write it in the form x = g(y), which explains why we solved for x.
Note
This process won't work for a function that is not one-to-one. For example, when we try to solve y = x2 + 1 for x, we get two possible solutions; x =(y-1)1/2 and x = -(y-1)1/2. In this case, the given function f is not invertible; if you look at its graph (a parabola) and flip it about the line y = x, you get a curve (a sideways parabola) that is not the graph of a function, as it fails the vertical line test. Alternatively, the graph of f fails the horizontal line test.
Here is one for you to participate in.
Logarithmic and Exponential Functions
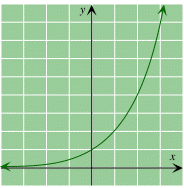
Here is the graph of the exponential function f(x) = 2x.

To obtain its inverse, we set
and solve for x. But doing this amounts to nothing more than writing the above equation in logarithmic form:
Hence the inverse of the exponential function f(x) = 2x is
Here are the graphs of f and f-1 on the same set of axes.

The relationship between logarithmic and exponential functions does not, or course, depend on the base 2, and we have the following more general result.
|
Exponential and Logarithmic Functions
The following identities follow from the inverse relationship between f and g.
In particular, we can choose the base b to be either e or 10 and obtain:
|
Q Is there a direct way of seeing why those identities are true?
A Look at the first identity,
The left-hand side, logb( bx), means the power to which you must raise b in order to get bx, and this is obviously the x power. Turning to the second identity,
the left-hand side is, in words, b raised to the power to which you must raise b in order to get x. Surely that must give you x! (It's like saying "The name of the person whose name is Earl, is Earl!")
You can now now go on and try the exercise set for this topic.
Last Updated:February, 2003