3.1 Limits: Numerical and Graphical Approaches
(This topic appears in Section 3.1 in Applied Calculus or Section 10.1 in Finite Mathematics and Applied Calculus)

Estimating Limits Graphically
(Similar to Example 4 in Section 3.1 in Applied Calculus or Section 10.1 in Finite Mathematics and Applied Calculus)
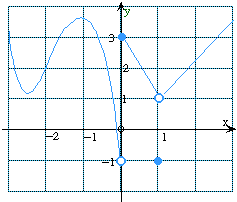
Look at the following graph of the function f:
From the graph, let us try to estimate limx→-2 f(x). If we were estimating the limit numerically , we would want a table that shows what is happening to the y-coordinates as the x-coordinate approaches -2 from both sides. Since we are estimating the limit graphically, we instead use the following procedure.
|
Estimating Limits Graphically
To decide whether limx→a f(x) exists, and to find its value if it does:
|
|
Step 1. Draw the graph of f(x) either by hand or using technology, such as a graphing calculator.
|
 |
|
|
Step 2. Position your pencil point (or the graphing calculator "trace" cursor) on a point of the graph to the right of x = a.In the example illustrated, we are estimating
limx→-2 f(x), so we have a = -2. Therefore, we position our trace point on the graph to the right of x = -2. |
 |
|
Step 3. Move the point along the graph toward x = a from the right and read the y-coordinate as you go. The value the y-coordinate approaches (if any) is then the limit
lim
x→a | f(x). |
In the example we are doing, notice that the y-coordinate is approaching 2 as x approaches -2 from the right. (Press "Run" under the graph to see this happen.) Therefore,
lim
x→-2 | f(x) = 2. |
|
|
|
Step 4. Repeat Steps 2 and 3, but this time starting from a point on the graph to the left of x = a, and approach x = a along the graph from the left. The value the y-coordinate approaches (if any) is then
lim
x→a | f(x). |
In the example we are doing, the y-coordinate is again approaching 2 as x approaches -2 from the left. Therefore,
lim
x→-2 | f(x) = 2. |
|
|
|
Step 5. If the left and right limits both exist and have the same value L, then
lim
x→a | f(x) exists and equals L. |
In our example, the left and right limits both exist and equal 2, and so
|
|

Q What does the animated picture below tell you? (Press "Run" to see the animation.)
| Q |
Referring again to the above graph, what is |
lim
x→0 | f(x)? |
Q Continuing, say which of the following is true.
 | lim
x→0 | f(x) = 3 |
|

| lim
x→0 | f(x) = -1 |
 | lim
x→0 | f(x) = 0 |
|
 | lim
x→0 | f(x) does not exist |
 |
| Q |
Referring again to the above graph, what can you say about |
lim
x→1 | f(x)? |
 | The limit does not exist. |
|

| The limit is 1. |
 | The limit is -1 |
|
 | The limit cannot be determined. |
 |

Now try the exercises in Section 3.1 in Applied Calculus or Section 10.1 in Finite Mathematics and Applied Calculus.
Alternatively, go on to the Tutorial on Limits and Continuity.

Top of Page
Last Updated: March, 2007
Copyright © 1999, 2003, 2006, 2007 Stefan Waner


