| Go to Part A. Calculating Conditional Probability | Go to Part C. Independent Events |

Let us go back to the stock price question in Part A, and add some additional information.
You have invested in Home-Clone Inc. stocks, as you suspect that the company's "Clone-a-Sibling" kit will shortly be approved by the FDA. There is an 80% chance that FDA approval will be given, and a 95% chance that the value of the stock you hold will double if FDA approval is given. If FDA approval is not given, then there is only a 10% chance of your stock doubling.
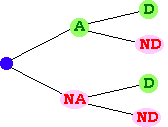
This seems to describe a two-stage "decision" process:
We can model this using a "decision" tree which branches twice; once for each decision stage shown above.
| Start |  |
FDA approves & stock price doubles | |
| FDA approves & stock price does not double | |||
| FDA does not approve & stock price doubles | |||
| FDA does not approve & stock price does not double | |||
| Key: |  | FDA approves |  | FDA does not approve |
 | Stock price doubles |  | Stock price does not double |
Q What are the probabilities of each outcome?
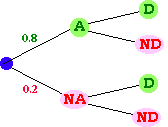
A Since there is 80% chance that the FAD will approve the kit, the probability of approval is 0.8, and the probability of disapproval is therefore 0.2. These probabilities can be added to Stage 1 of the tree:
| Start |  |
FDA approves & stock price doubles | |
| FDA approves & stock price does not double | |||
| FDA does not approve & stock price doubles | |||
| FDA does not approve & stock price does not double | |||
Note that the sum of the probabilities leaving the start node is 1.
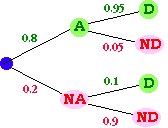
Now for Stage 2. We are told that, if FDA approval is given (putting us at the "A" node), the probability of the stock doubling is 0.95 (95%). This allows us to fill in the branches on the upper right.
On the other hand, if we are at the "NA" node (FDA dfoes not approve) then the probability of the stock doubling is only 0.1 (10%). This allows us to fill in the remaining branches:
| Start |  |
FDA approves & stock price doubles | |
| FDA approves & stock price does not double | |||
| FDA does not approve & stock price doubles | |||
| FDA does not approve & stock price does not double | |||
Again, notice that the sum of the probabilities on the arrows leaving each node is 1.
Finally, to obtain the probabilities a specific outcome, we mutliply all the probabilities along the path leading to that outcome
Example The first outcome is: "FDA approves & stock price doubles." It probability is given by (0.8)(0.95) = 0.76.
Here is the completed tree diagram:
| Start |  |
FDA approves & stock price doubles | ||
| FDA approves & stock price does not double | ||||
FDA does not approve & stock price doubles |
||||
| FDA does not approve & stock price does not double | ||||
| Sum: |   1.0 |
|||
| Key: |  | FDA approves |  | FDA does not approve |
 | Stock price doubles |  | Stock price does not double |

Referring to the above tree, P(ND|A) = ?
 | 0.05 | 
| 0.04 |  | 0.20 |  | 0.95 |  |
Which of the following conditional probabilities already appear on the tree?
 | P(A|D) | 
| P(D|NA) |  | P(D|A) |  | P(A|ND) |  |

Here once again is the tree (to save the bother of scrolling back and forth).
| Start |  |
FDA approves & stock price doubles | ||
| FDA approves & stock price does not double | ||||
FDA does not approve & stock price doubles |
||||
| FDA does not approve & stock price does not double | ||||
| Sum: |   1.0 |
|||

Referring to the above tree, the probability that the stock did not double, is?
 | 0.0072 | 
| 0.95 | 
| 0.22 |  | 0.045 |  |
Referring to the above tree, the probability that the FDA did not approve the kit, given that the stock did not double, is?
 | 1/9 | 
| 11/50 |  | 9/10 |  | 9/11 |  |
Here is the table from Part A showing a fictitious statistical study of a new acne cream.
| Skin Improved | ||
| No Improvement |
Which of the following trees correctly models the scenario?
|
|
||||||||||||||||||||
|
|
||||||||||||||||||||
 |
You now have several options:
